Introduction
Due to Remgro being an investment holding company, traditional measurements of performance, such as sales or gross profit, are not meaningful criteria for evaluating the Group’s performance. However, management uses “headline earnings“, “intrinsic net asset value“ and “cash at the centre“ to evaluate the performance of the Group on a continuous basis and hence these concepts are used throughout the Integrated Annual Report to provide shareholders with a better understanding of our results.
Results
Comparison with prior year
RMB Holdings Limited (RMH) and FirstRand Limited (FirstRand)
During June 2020 Remgro unbundled its 28.2% interest in RMH (RMH Unbundling) and, consequently, the investment in RMH was treated as a discontinued operation for the year ended 30 June 2020. For the year under review, earnings and headline earnings measures are again presented for continuing operations and discontinued operations and, accordingly, discontinued operations for the prior year include the equity accounted income of RMH.
It should also be noted that with effect from 8 June 2020, Remgro ceased to have significant influence over FirstRand due to, amongst other factors, the RMH Unbundling and therefore the investment was reclassified from an equity accounted investment to an investment at fair value through other comprehensive income (FirstRand Reclassification). For the comparative year, the investment in FirstRand was equity accounted whereas, from the date of the FirstRand Reclassification, only dividend income is accounted for FirstRand in the income statement. Dividends of R191 million were received from FirstRand during the year under review (2020: cash dividends of R655 million). As a result of the Covid-19 pandemic, FirstRand only paid an interim dividend during the year under review.
Each significant investment is classified as an operating segment. Operating segments are presented in platforms. Platforms consist of investments with similar economic characteristics. As reported previously, the platforms under which the results of investee companies are being reported to the Chief Operating Decision-Maker were changed and certain investments reallocated in line with internal reporting to enhance stakeholder communication. The Media and sport and Other investments platforms that were reported under up to the 2020 financial year, were replaced by the following new platforms:
- Media (consisting mainly of eMedia Investments Proprietary Limited (eMedia Investments));
- Portfolio investments (non-strategic investments consisting mainly of FirstRand and British American Tobacco plc (BAT));
- Diversified investment vehicles (entities whose main business is to make investments consisting mainly of Kagiso Tiso Holdings Proprietary Limited (KTH), the Asian funds, Invenfin Proprietary Limited (Invenfin) and Pembani Remgro Infrastructure Fund (PRIF)); and
- Social impact investments (consisting mainly of the Blue Bulls rugby franchise and Stellenbosch Academy of Sport Proprietary Limited (SAS)).
Comparative figures have been re-presented accordingly.
Results in context
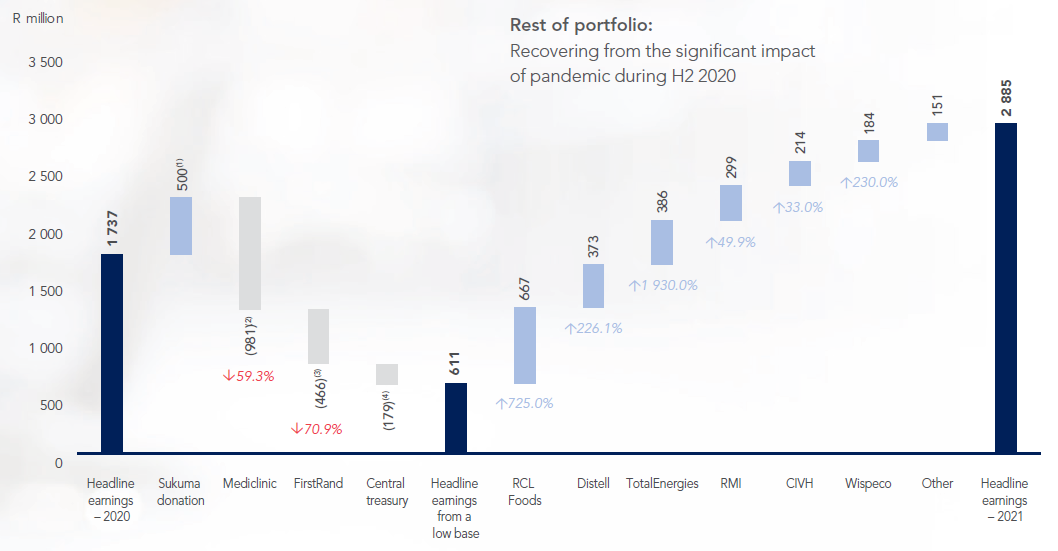
The headline earnings from continuing operations for the comparative year were significantly impacted, during the second six months to 30 June 2020, by the Covid-19 pandemic and the resultant lockdown measures, as well as a once-off donation of R500 million to The South African SME Relief Trust (The SA SME Relief Trust). From this low base, the increase in headline earnings from continuing operations for the year under review is mainly due to the recovery of the earnings of most of Remgro’s underlying investee companies (most notably RCL Foods Limited (RCL Foods), Distell Group Holdings Limited (Distell), TotalEnergies Marketing South Africa Proprietary Limited (TotalEnergies) and Rand Merchant Investment Holdings Limited (RMI)). This increase is partly offset by a lower contribution from Mediclinic International plc (Mediclinic) (Mediclinic’s contribution includes the full impact of the Covid-19-
related lockdown measures on their results for the year ended 31 March 2021), as well as lower interest income, due to the 300 basis points reduction in interest rates since January 2020. Furthermore, due to the accounting reclassification of FirstRand from an equity accounted investment to an investment at fair value through other comprehensive income, only dividend income of R191 million was accounted from FirstRand for the year under review, whereas earnings of R657 million were equity accounted in the comparative year.
Financial year ended 30 June 2021: Results in context
Salient features
| |
Year ended
30 June
2021 |
Year ended
30 June
2020 |
%
change |
| Total headline earnings (R million) |
2 885 |
3 167 |
(8.9) |
| – per share (cents) |
510.6 |
560.6 |
(8.9) |
| Headline earnings from continuing operations (R million) |
2 885 |
1 737 |
66.1 |
| – per share (cents) |
510.6 |
307.5 |
66.0 |
| Earnings (R million) |
3 550 |
6 646 |
(46.6) |
| – per share (cents) |
628.3 |
1 176.4 |
(46.6) |
| Dividends per share (cents) |
|
|
|
| Ordinary |
90.00 |
265.00 |
(66.0) |
| – Interim |
30.00 |
215.00 |
(86.0) |
| – Final |
60.00 |
50.00 |
20.0 |
| |
|
|
|
| Intrinsic net asset value per share (Rand) |
177.33 |
154.47 |
14.8 |
| |
|
|
|
Headline earnings
Overview
For the year to 30 June 2021, headline earnings from continuing operations increased by 66.1% from R1 737 million to R2 885 million, while headline earnings per share (HEPS) from continuing operations increased by 66.0% from 307.5 cents to 510.6 cents. Total headline earnings and total HEPS decreased by 8.9% from R3 167 million to R2 885 million, and from 560.6 cents to 510.6 cents, respectively.
The increase in headline earnings from continuing operations is mainly due to higher contributions from RCL Foods, Distell, TotalEnergies, RMI and Community Investment Ventures Holdings Proprietary Limited (CIVH) (lower losses), as well as the once-off donation of R500 million to The SA SME Relief Trust in the comparative year. This increase is partly offset by lower contributions from Mediclinic and FirstRand, as well as lower interest income.
Contribution to headline earnings by reporting platform
| R million |
Year ended
30 June
2021 |
%
change |
Year ended
30 June
2020 |
| Healthcare |
674 |
(59.3) |
1 655 |
| Consumer products |
1 576 |
189.2 |
545 |
| Financial services |
921 |
47.6 |
624 |
| Infrastructure |
(376) |
47.5 |
(716) |
| Industrial |
1 014 |
279.8 |
267 |
| Diversified investment vehicles |
(260) |
(2.0) |
(255) |
| Media |
53 |
(32.1) |
78 |
| Portfolio investments |
247 |
(64.5) |
695 |
| Social impact investments |
(66) |
(447.4) |
19 |
| Central treasury |
|
|
|
| – finance income |
212 |
(55.7) |
479 |
| – finance costs |
(861) |
9.5 |
(951) |
| – option remeasurement |
– |
(100.0) |
2 |
| Other net corporate costs |
(249) |
64.7 |
(705) |
| Headline earnings from continuing operations |
2 885 |
66.1 |
1 737 |
| Discontinued operations |
– |
(100.0) |
1 430 |
| Total headline earnings |
2 885 |
(8.9) |
3 167 |
| |
|
|
|
Commentary on reporting platforms’ performance
Healthcare
Mediclinic’s contribution to Remgro’s headline earnings amounted to R674 million (2020: R1 655 million), representing a decrease of 59.3%. Mediclinic uses adjusted earnings, which removes volatility associated with certain types of exceptional income and charges, in evaluating performance and as a method to provide its shareholders with clear and consistent reporting. For the year under review the main difference between adjusted earnings and headline earnings related to an accelerated depreciation and amortisation charge and a remeasurement of a redemption liability, whereas the comparative year included a tax credit in respect of a reduction in Swiss statutory tax rates. Remgro’s portion of Mediclinic’s adjusted earnings amounted to R959 million (2020: R1 480 million), representing a decrease of 35.2%.
Mediclinic’s revenue and profitability were significantly impacted in April 2020 by Covid-19-related lockdown measures and non-urgent elective procedure restrictions. From May 2020 onwards, the moderation of restrictions resulted in a strong rebound in operating performance in Switzerland and the Middle East. Southern Africa experienced a more gradual recovery as it exited the first wave.
Despite a subsequent and more severe wave of the pandemic in the second half of Mediclinic’s financial year, Mediclinic delivered an improved financial performance supported by less restrictive lockdown measures, greater operational flexibility and counter-seasonal demand in Southern Africa and the Middle East during December 2020. Mediclinic’s revenue for the full year decreased by 3% (down 1% in constant currency terms), while stronger demand in the second half of Mediclinic’s financial year delivered revenue growth of 1%.
In British pound terms, Mediclinic reported a decrease in adjusted earnings of 42.9%, reflecting the weakened average SA rand exchange rate against the British pound. This decrease is mainly due to the revenue decline exacerbated by the largely fixed employee cost base, depreciation and amortisation, as well as an escalation in PPE usage, consumables pricing and staffing requirements due to isolation and quarantine regulations. Incremental Covid-19-related expenses approximated £32 million.
Consumer products
The contribution from consumer products to Remgro’s headline earnings amounted to R1 576 million (2020: R545 million), representing an increase of 189.2%.
RCL Foods’ contribution to Remgro’s headline earnings amounted to R759 million (2020: R92 million), representing an increase of 725.0%. RCL Foods discloses underlying headline earnings, adjusted for Covid-19 direct costs incurred and certain elements of the gain on bargain purchase, relating to Vector Logistics’ acquisition of the Imperial cold chain business, in the comparative year. Underlying headline earnings provides RCL Foods’ users with relevant information and measures used by itself to assess performance. Covid-19 specific costs for the period amounted to R121 million (2020: R267 million). RCL Foods reported an increase in underlying headline earnings of 170.9%, driven by an excellent performance in the Sugar and Baking business units and continued strong delivery in Grocery. Sugar’s record result was mainly driven by increased consumer demand, tight cost control combined with a successful shift in its sales mix towards higher-priced local market sales. The increased local sugar demand and a shrinking industry crop have created a more favourable supply-demand balance. A higher world sugar price has also impacted favourably on export revenue. The strong Baking performance was underpinned by a successful turnaround in the Gauteng bakeries, as well as a more favourable sales mix in the Milling operating unit. Chicken delivered a disappointing result impacted by continuing breed performance challenges, significant raw material cost increases and the lingering impacts of the initial Covid-19 lockdown, compounded by Avian Influenza.
Distell’s contribution to headline earnings amounted to R538 million (2020: R165 million), representing an increase of 226.1%. Distell discloses normalised earnings, adjusted for abnormal transactions and currency movements, to indicate its businesses’ performance. These abnormal transactions included retrenchment and restructuring costs, as well as credit loss provisions on Zimbabwe savings bonds in the comparative year. Distell reported an increase in normalised headline earnings of 302.4%, mainly due to an increase of 26.3% in revenue on 26.3% higher volumes and the containment of operating costs. This represents a 7.9% revenue increase and a 2.1% volume decline when compared to the pre-Covid levels in the 2019 financial year. Domestic revenue and volumes increased by 29.4% and 28.7%, respectively, despite a 20% reduction in trading days being lost due to the second and third sale of alcohol bans. Domestically Distell gained market share across all three of its categories (ciders and ready-to-drink beverages (RTDs), spirits and wine). Revenue and volumes in the African markets, outside South Africa, increased by 22.9% and 30.7%, respectively, also due to excellent growth across all three categories. In the international markets, outside Africa, revenue increased by 10.0% alongside a volume decline of 10.8%. The increase in international revenue is mainly due to the cessation of sales of non-core wine brands, bulk whisky and the exit from the RTD business. In addition to Distell’s contribution, Remgro also accounted for amortisation and depreciation charges of R47 million (2020: R47 million) relating to the additional assets identified when Remgro obtained control over Distell on 11 May 2018.
The headline earnings contribution from Siqalo Foods Proprietary Limited (Siqalo Foods) amounted to R405 million (2020: R414 million), representing a decrease of 2.2%. In terms of the transition agreement with Unilever, Siqalo Foods received an after-tax finalisation amount of R31 million from Unilever in the comparative year. Excluding the finalisation amount, Siqalo Foods’ contribution to headline earnings increased from R383 million to R405 million (or 5.7%). This increase is mainly due to a 5.5% increase in volumes. Good cost management enabled the business to increase its operational EBITDA by 6.7%. In addition to Siqalo Foods’ contribution, Remgro also accounted for amortisation and depreciation charges of R79 million (2020: R79 million) relating to the additional assets identified when Remgro obtained control over Siqalo Foods on 2 July 2018.
Financial services
The contribution from financial services to Remgro’s headline earnings amounted to R921 million (2020: R624 million), representing an increase of 47.6%.
RMI’s contribution to Remgro’s headline earnings increased by 49.9% to R898 million (2020: R599 million). On a normalised basis, which excludes certain anomalies, RMI reported an increase of 14.9% in earnings. Despite the Covid-19 pandemic, with elevated mortality experience impacting materially on its life insurance operations, RMI delivered a strong overall operational performance, with pleasing growth being achieved by both OUTsurance Holdings Limited (OUTsurance) and Hastings Group Holdings plc (Hastings), its two large short-term insurance investments. Furthermore, the positive impact of the lower interest rate environment, on RMI’s funding costs, and excellent performance by RMI Investment Managers also contributed to the strong performance.
OUTsurance’s earnings (excluding its share in Hastings) increased by 14.3%, driven by strong equity market returns and an increase in gross written premiums, while Hastings’ earnings increased by 20.1% mainly due to a lower claims ratio. The decrease in Momentum Metropolitan Holdings Limited’s (Momentum Metropolitan) earnings (down by 33.8%) is largely attributable to the prolonged negative impact that Covid-19 had on mortality claims experience, including the anticipated impact of the ongoing third and possible fourth waves. The earnings of Discovery Limited (Discovery) decreased by 9.1% mainly due to the Covid-19 related impact on Discovery Life.
Business Partners Limited’s (Business Partners) contribution to Remgro’s headline earnings decreased by 8.0% to R23 million (2020: R25 million). This decrease is mainly due to lower net interest income, resulting from a 300 basis points decrease in the average interest rate, and a decrease in net property revenue, due to increased vacancies and rental relief provided. The decrease is partly offset by lower net credit losses. Net credit losses for the comparative year incorporated the impact of the devastation of the Small and Medium Enterprises (SMEs) sector caused by the Covid-19 pandemic.
Infrastructure
CIVH’s contribution to Remgro’s headline earnings amounted to a loss of R435 million (2020: a loss of R649 million). Included in CIVH’s comparative year is once-off costs relating to the financing of the Vumatel Proprietary Limited (Vumatel) acquisition, as well as costs incurred on CIVH’s debt refinance process, which was finalised in December 2019. The decrease in losses is also due to an increase in annuity income at Dark Fibre Africa Proprietary Limited (DFA) and subscriber growth at Vumatel. DFA’s revenue marginally increased to R2 483 million (2020: R2 465 million) impacted by lower once-off revenue due to Covid-19. DFA’s annuity income amounted to R192 million per month on 31 March 2021 (31 March 2020: R179 million per month). Vumatel’s revenue increased by 50.1% to R2.4 billion, driven by accumulated subscriber uptake growth.
Grindrod Limited’s (Grindrod) and SEACOM Capital Limited’s (SEACOM) contributions to Remgro’s headline earnings amounted to R16 million and R26 million (2020: losses of R12 million and R10 million), respectively, while other infrastructure investments include Grindrod Shipping Holdings Limited’s (Grindrod Shipping) contribution, which amounted to a profit of R19 million (2020: a loss of R46 million). The increased profit from Grindrod Shipping is mainly due to the improving market conditions in the drybulk sector.
Industrial
Air Products’ contribution to Remgro’s headline earnings decreased by 3.3% to R322 million (2020: R333 million). This decrease is mainly due to difficult trading conditions, largely due to the impact of Covid-19. Although trading conditions have improved, growth opportunities are limited as a result of low levels of capital investment in the economy.
TotalEnergies’ contribution to Remgro’s headline earnings amounted to a profit of R366 million (2020: loss of R20 million). Included in the contribution to headline earnings for the year under review are favourable stock revaluations amounting to R186 million (2020: unfavourable stock revaluations amounting to R229 million). These revaluations are the result of the volatility in the Brent Crude price and the rand exchange rate. Excluding these revaluations, the contribution decreased by 13.9% from R209 million to R180 million. This decrease is mainly due to a significant drop in volumes in the retail network, mining and commercial sectors due to the impact of the Covid-19 lockdown, as well as Natref’s depressed refining margins and the poor economics having a domino effect of reduced crude treatment.
Wispeco Holdings Proprietary Limited’s (Wispeco) contribution to Remgro’s headline earnings increased by 230.0% to R264 million (2020: R80 million) mainly due to higher sales volumes, which also unlocked economy of scale efficiencies in the manufacturing operations, and gains yielded due to an upward commodity price cycle. The weakened SA rand and escalating international shipping costs prompted importers to redirect orders to local extruders.
Other industrial investments consist of PGSI Limited’s (PGSI) contribution to Remgro’s headline earnings, which amounted to a profit of R62 million (2020: a loss of R126 million).
Diversified investment vehicles
KTH’s contribution to headline earnings amounted to a loss of R182 million (2020: loss of R164 million). The earnings of KTH include a negative fair value adjustment on its investment in Actom Investment Holdings Proprietary Limited of R434 million (2020: R260 million), partly offset by the positive fair value adjustment on its investment in Momentum Metropolitan of R60 million (2020: negative fair value adjustment of R69 million).
The contribution from other diversified investment vehicles to headline earnings amounted to a loss of R78 million (2020: loss of R91 million). Other diversified investment vehicles include the contribution from Invenfin, which amounted to a loss of R128 million (2020: a loss of R106 million). Invenfin’s loss is mainly due to losses from its investment in Bos Brands Proprietary Limited. These losses are partly offset by dividends received from Remgro’s investment in PRIF amounting to R55 million.
Media
eMedia Investments’ contribution to Remgro’s headline earnings decreased by 44.9% to R43 million (2020: R78 million). This decrease is mainly due to lower advertising revenue, being the major source of revenue for eMedia Investments. Tough trading conditions due to the pandemic continued for the free-to-air broadcasting industry with advertising revenue under increased pressure. eMedia Investments’ television advertising revenue is approximately 8% better than the market and this can be attributed to the increased prime time market share from 24.6% in March 2020 to 29.6% in March 2021, an increase of 20.3%.
Portfolio investments
The contribution from portfolio investments to headline earnings amounted to R247 million (2020: R695 million). This decrease is mainly due to dividends of R191 million received from FirstRand, as opposed to equity accounted earnings of R657 million in the comparative year. Other portfolio investments include the dividends received from BAT and Reinet Investments SCA amounting to R56 million (2020: R38 million).
Social impact investments
Social impact investments primarily consist of various sport interests, including an interest in the Blue Bulls rugby franchise and SAS.
Central treasury and other net corporate costs
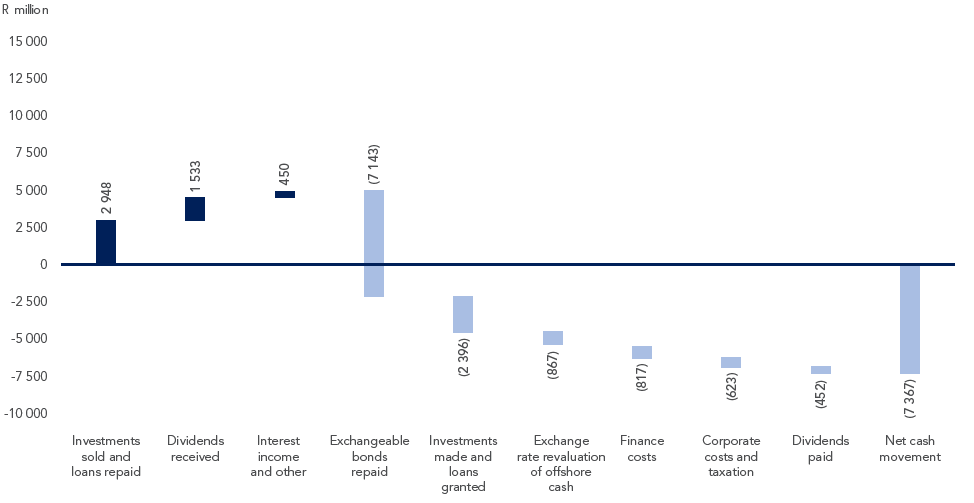
Finance income amounted to R212 million (2020: R479 million). This decrease is mainly due to lower local interest earned, resulting from the 300 basis points reduction in the South African repo rate, announced since January 2020, as well as a lower local average cash balance. Finance costs is lower at R861 million (2020: R951 million), mainly due to the redemption of the exchangeable bonds in cash on 22 March 2021.
Other net corporate costs amounted to R249 million (2020: R705 million). This decrease is mainly due to the once-off donation of R500 million to The SA SME Relief Trust in the comparative year.
Earnings
Total earnings decreased by 46.6% to R3 550 million (2020: R6 646 million). It should be noted that apart from the increase in headline earnings from continuing operations discussed above (up by R1 148 million) and the equity accounted earnings of RMH in the comparative period amounting to R1 395 million, earnings includes other once-off items, which cause comparability of earnings to be challenging. These are:
- the accounting profit realised on the RMH Unbundling and FirstRand Reclassification totaling R11 588 million in the 2020 financial year;
- Remgro’s portion of the impairment of Mediclinic’s assets in Switzerland and the Middle East and its investment in Spire Healthcare Group plc (Spire) of R4 330 million in the 2020 financial year;
- the impairment of goodwill of R1 809 million relating to Remgro’s investment in Distell in the 2020 financial year;
- Remgro’s portion of the impairments of RCL Foods’ underlying divisions of R970 million in the 2020 financial year; and
- the reversal of impairment of Remgro’s investments in Grindrod of R488 million (2020: impairment of R596 million) and Grindrod Shipping of R607 million (2020: impairment of R112 million).
Cash at the centre
| |
30 June 2021 |
|
| |
Currency
value
million |
Exchange
rate |
R million |
30 June
2020
R million |
| SA rand |
|
|
7 511 |
6 721 |
| USA dollar |
151.0 |
14.2832 |
2 157 |
2 770 |
| British pound |
1.5 |
19.7408 |
29 |
7 572 |
| Swiss franc |
0.6 |
15.4302 |
9 |
10 |
| |
|
|
9 706 |
17 073 |
| |
|
|
|
|
Cash movement at the holding company (cash at the centre)
| Closing exchange rates |
30 June
2021
|
30 June
2020
|
Movement
%
|
| USD/ZAR |
14.2832 |
17.3475 |
17.7 |
| GBP/ZAR |
19.7408 |
21.4537 |
8.0 |
| CHF/ZAR |
15.4302 |
18.3145 |
15.7 |
| |
|
|
|
| Average exchange rates |
Year ended
30 June
2021
|
Year ended
30 June
2020
|
Movement
%
|
| USD/ZAR |
15.4003 |
15.6594 |
1.7 |
| GBP/ZAR |
20.7035 |
19.7171 |
(5.0) |
| CHF/ZAR |
16.9174 |
16.0512 |
(5.4) |
| |
|
|
|
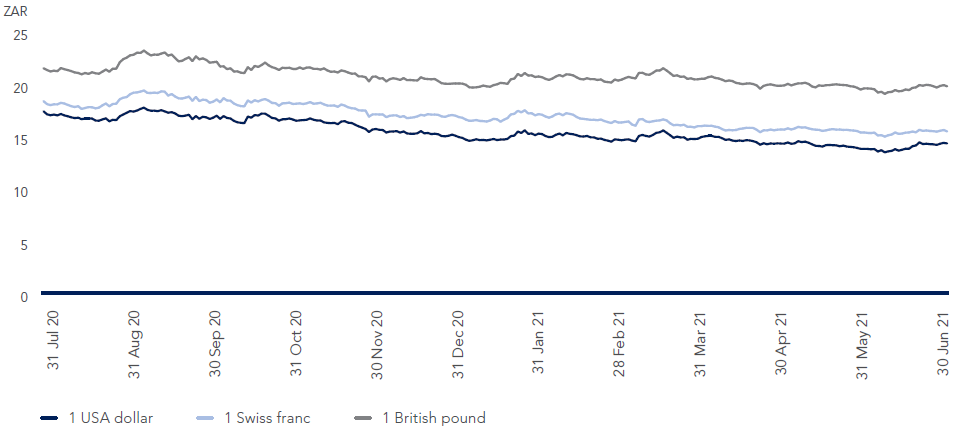
ZAR vs foreign currencies Remgro holds
Cash at the centre and foreign exchange rates
On 30 June 2021 Remgro’s cash at the centre amounted to
R9 706 million (2020: R17 073 million), of which 23% was invested offshore (2020: 61%). The cash is held in different currencies of which approximately 78% was held in SA rand and 22% in USA dollar.
Foreign exchange profits amounting to R867 million (2020: R1 638 million) were accounted for during the year under review, due to the weakening of the SA rand against the USA dollar from R17.35 = $1.00 at 30 June 2020, to
R14.28 = $1.00 at 30 June 2021, and the weakening of the
SA rand against the British pound from R21.45 = £1.00 at
30 June 2020, to R19.74 = £1.00 at 30 June 2021. For accounting purposes these exchange movements are accounted for directly in equity.
Remgro’s offshore cash is earmarked for potential new investments and the expansion of existing offshore investments (USA dollar).
External funding
During the 2016 financial year Remgro (through its wholly owned subsidiary Remgro Healthcare Holdings Proprietary Limited (RHH)) issued Class A preference shares of R3.5 billion (four-year tenure and a fixed dividend rate of 7.7%) and Class B preference shares of R4.4 billion (five-year tenure and a fixed dividend rate of 8.3%). During March 2019 the maturity date of the Class A preference shares was extended to 15 January 2024 (at a fixed dividend rate of 7.5% effective from 17 June 2019) and the
Class B preference shares was extended to 17 March 2025 (at a fixed dividend rate of 7.8% effective from 16 March 2021).
On 22 March 2016 Remgro also issued exchangeable bonds (through its wholly owned subsidiary, Remgro Jersey GBP Limited) amounting to £350 million. These exchangeable bonds were redeemed in cash on 22 March 2021.
Dividends
The final dividend per share was determined at 60 cents
(2020: 50 cents). Total ordinary dividends per share in respect of
the year to 30 June 2021 therefore amounted to 90 cents (2020: 265 cents), representing a decrease of 66.0%. The final dividend of 2020, as well as the interim and final dividends of 2021, were adjusted downwards to take into account the RMH Unbundling during the prior year and the ongoing impact of the Covid-19 pandemic.
Intrinsic net asset value
Remgro’s intrinsic net asset value per share at 30 June 2021 was R177.33 compared to R154.47 on 30 June 2020. Refer to the Chief Executive Officer’s Report for a detailed discussion regarding Remgro’s intrinsic net asset value and its relative performance with certain selected JSE indices.
Accounting policies
The Annual Financial Statements have been prepared in accordance with International Financial Reporting Standards (IFRS). The accounting policies have been consistently applied to both years presented. During the year under review various other interpretations and amendments became effective, but their implementation had no impact on the results of either the current or prior years.
Risk and opportunities management
The Company has implemented a comprehensive Risk and Opportunities Management Policy that is based on the principles of the international COSO (Committee of Sponsoring Organisations of the Treadway Commission) Enterprise Risk Management – Integrated Framework and complies with the recommendations of the King IV Report on Corporate Governance for South Africa (2016). An extensive risk and opportunities management structure furthermore ensures the effective and efficient management of risk and opportunities within the Group.
Remgro’s risk and opportunities management process is summarised in the Risk and Opportunities Management Report, as well as in note 13 to the comprehensive Annual Financial Statementsthat is published on the Company’s website.

Neville Williams
Chief Financial Officer
Stellenbosch
21 September 2021
Composition of total headline earnings(1)
| R million |
Year ended
30 June
2021
|
%
change
|
Year ended
30 June
2020
|
| Healthcare |
|
|
|
| Mediclinic |
674 |
(59.3) |
1 655 |
| |
|
|
|
| Consumer products |
|
|
|
| RCL Foods |
759 |
725.0 |
92 |
| Distell – entity contribution |
538 |
226.1 |
165 |
| – IFRS 3 charge(2) |
(47) |
– |
(47) |
| Siqalo Foods – entity contribution |
405 |
(2.2) |
414 |
| – IFRS 3 charge(2) |
(79) |
– |
(79) |
| |
|
|
|
| Financial services |
|
|
|
| RMI |
898 |
49.9 |
599 |
| Business Partners |
23 |
(8.0) |
25 |
| |
|
|
|
| Infrastructure |
|
|
|
| CIVH |
(435) |
33.0 |
(649) |
| Grindrod |
16 |
233.3 |
(12) |
| SEACOM |
26 |
360.0 |
(10) |
| Other infrastructure investments |
17 |
137.8 |
(45) |
| |
|
|
|
| Industrial |
|
|
|
| Air Products |
322 |
(3.3) |
333 |
| TotalEnergies |
366 |
1 930.0 |
(20) |
| Wispeco |
264 |
230.0 |
80 |
| Other industrial investments |
62 |
149.2 |
(126) |
| |
|
|
|
| Diversified investment vehicles |
|
|
|
| KTH |
(182) |
(11.0) |
(164) |
| Other diversified investment vehicles |
(78) |
14.3 |
(91) |
| |
|
|
|
| Media |
|
|
|
| eMedia Investments |
43 |
(44.9) |
78 |
| Other media investments |
10 |
– |
– |
| |
|
|
|
| Portfolio investments |
|
|
|
| FirstRand |
191 |
(70.9) |
657 |
| Other portfolio investments |
56 |
47.4 |
38 |
| |
|
|
|
| Social impact investments |
(66) |
(447.4) |
19 |
| |
|
|
|
| Central treasury |
|
|
|
| Finance income |
212 |
(55.7) |
479 |
| Finance costs |
(861) |
9.5 |
(951) |
| Option remeasurement |
– |
(100.0) |
2 |
| |
|
|
|
| Other net corporate costs |
(249) |
64.7 |
(705) |
| Headline earnings from continuing operations |
2 885 |
66.1 |
1 737 |
| Discontinued operations |
– |
(100.0) |
1 430 |
| Total headline earnings |
2 885 |
(8.9) |
3 167 |
| Weighted number of shares (million) |
565.0 |
– |
565.0 |
| Total headline earnings per share (cents) |
510.6 |
(8.9) |
560.6 |
| |
|
|
|