Introduction
Reflecting back on what has been another rollercoaster of a year, it has reminded me once again of our incredibly rich history as a country and as a Group. South Africa has been through many highs and lows in these 73 years of Remgro’s existence, and Remgro has been a part of constantly watching, participating, and adapting to these changing times as a proud and responsible corporate citizen.
We are proud of who we were and what we are, and we are excited about who we can be. We understand the importance of relevance and the need to be adaptable, and as such saw 2020, the year of the pandemic, as the ideal and most opportune time to introspect, reflect and recalibrate. Coming out of that process, which remains ongoing, we believe now is the time to reset – to do more than pause and adjust but to recognise the harbingers of change.
Much like our first seeds, such as playing a founding role in the South African wine and spirits industry and being the co-founders of South Africa’s first cellular telephony company, we aim to continue identifying and nurturing a world fit for generations to come.
Some readers may have noticed the use of colour in our Integrated Annual Report for the first time, which aims to highlight the beginning of another journey of change that Remgro has embarked on. This report’s design, inspired by Stellenbosch artist Michelle-Lize van Wyk, who created an artwork reflecting Remgro’s life-giving system, is made up of our roots (our heritage and history) and our DNA (our culture and philosophy), and recognises our individual roles in a highly structured and organised Group that is beautifully unique, dynamic, and organic.* We believe that it is this system that will enable us to continue creating value sustainably, and as with all growing and living things, the health of the system determines how strong we can stand and how tall we can grow.
Much like our investment portfolio evolved since the late 1940s under the curatorship of the late Dr Anton Rupert, our vision and strategy guide us towards a newly sprouting, inclusive growth phase.
With a leadership team committed to a responsible investment philosophy, clear priority shifts and focus areas, we are set “to be the trusted investment company of choice that consistently creates sustainable stakeholder value”.
While Remgro’s intrinsic net asset value remains the most appropriate indicator of the value added for our shareholders, the rest of this report aims to provide (i) insight into Remgro’s valuation methodology and the integrity thereof;
(ii) a summary of our investment activities and commitments for the year; (iii) commentary on the prevailing economic climate; and (iv) an overview of the relative performance of Remgro’s INAV per share and internal rate of return measured against selected JSE indices.
Intrinsic net asset value
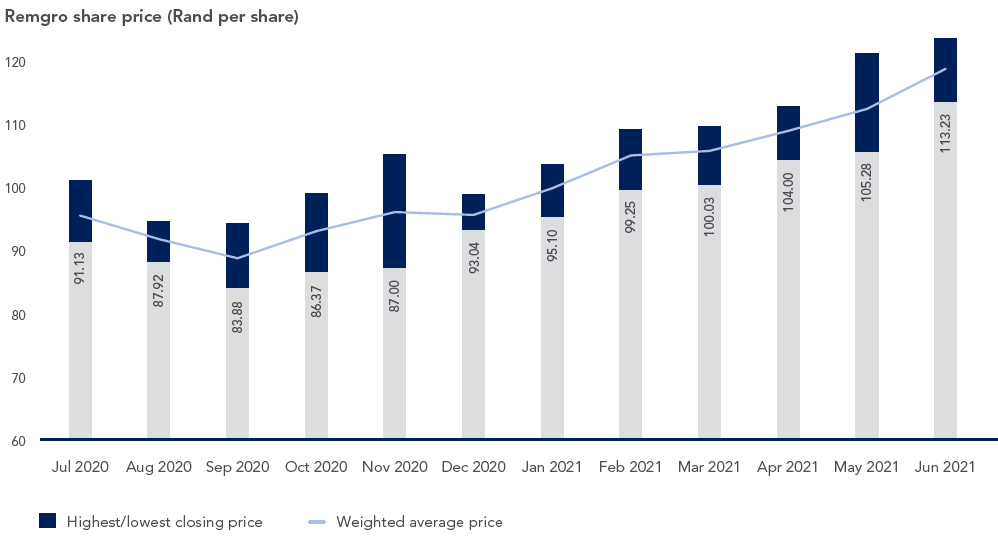
Remgro’s intrinsic net asset value per share increased by 14.8% from R154.47 at 30 June 2020 to R177.33 at 30 June 2021. The closing share price at 30 June 2021 was R114.60 (30 June 2020: R99.90), representing a discount of 35.4% (30 June 2020: 35.3%) to the intrinsic net asset value. As at 30 June 2021, 37% of Remgro’s underlying investee companies were represented by unlisted investments (2020: 38%). In this regard, it is worth noting that prior to the unbundling of Remgro’s interest in RMB Holdings Limited (RMH) on 8 June 2020, 23% of Remgro’s underlying investee companies were represented by unlisted investments, with the share price trading at a discount to intrinsic net asset value of less than 30%. While the subsequent widening of the discount was not anticipated at the time, it does highlight the importance of demonstrating the veracity of the intrinsic net asset valuations in a portfolio that will increasingly consist of more unlisted investments going forward.
The intrinsic net asset value of the Group includes valuations of all investments, incorporating subsidiaries, associates and joint ventures, either at listed market value, or in the case of unlisted investments, other inputs for the assets that are not based on observable market data.
Guidance in completing the valuations is obtained from
IFRS 13: Fair Value Measurement, where Fair Value is defined as the price that would be received to sell an asset or paid to transfer a liability in an orderly transaction between market participants at the measurement date. A fair value measurement assumes that a hypothetical transaction to sell an asset takes place in the principal market, or in its absence, the most advantageous market for the asset.
The values derived from the valuation exercise performed at measurement date fall within the IFRS 13 framework, which requires that, in the context of discounted cash flow valuations, the equity beta, capital structure and cost of debt be determined based on information obtained for similar assets or market participants, after certain adjustments are made. This impacts on the weighted average cost of capital (WACC) used when discounting the cash flows for purposes of the IFRS 13 valuation and is expected to be different from those applied in a transactional valuation approach as the target or actual inputs are replaced with inputs derived from considering the position of hypothetical market participants. Consequently, a valuation derived by applying the IFRS 13 framework is expected to differ from a transactional valuation.
During the year under review, and as a step towards ensuring the veracity of Remgro’s intrinsic net asset valuations, the Audit and Risk Committee established a Valuation Subcommittee to assist the Audit and Risk Committee to –
- determine the valuations of Remgro’s unlisted investments and the internal valuations of Remgro’s material listed investments; and
- recommend the valuations of Remgro’s unlisted investments and the internal valuations of Remgro’s material listed investments to the Remgro Board.
The Valuation Subcommittee is chaired by Mr Fred Robertson and consists of five non-executive directors (being two directors who serve on the Audit and Risk Committee and three directors who serve on the Investment Committee), the Chief Executive Officer and the Chief Financial Officer. As noted above, this function will become increasingly important as Remgro’s portfolio trends towards more unlisted investments.
Significant investment activities
During January 2021, Remgro subscribed for 54 738 shares in Community Investment Ventures Holdings Proprietary Limited (CIVH) for a total amount of R1 636 million in terms of a rights issue. This share subscription increased Remgro’s interest in CIVH marginally from 54.7% at 30 June 2020 to 55.2% at 30 June 2021. Subsequent to 30 June 2021, Remgro subscribed for a further 67 364 shares in CIVH for a total amount of R2 124 million in terms of a further rights issue, increasing Remgro’s interest in CIVH to 55.5%. The proceeds of both rights issues were used to reduce the CIVH group’s debt, as well as to unlock capital expenditure facilities for further growth.
During May 2021 Remgro sold 40 000 000 FirstRand Limited (FirstRand) shares through an accelerated book build offering for a gross consideration of R2 040 million (or R51.00 per share). The transaction reduced Remgro’s interest in FirstRand to 3.3% (2020: 4.0%).
During November and December 2020 Remgro acquired a further 28 940 412 RCL Foods Limited (RCL Foods) shares for
a total amount of R234 million. At 30 June 2021 Remgro’s effective interest in RCL Foods was 80.4% (2020: 77.1%).
During the year under review, Remgro committed to invest $25 million in Asia Partners I LP (Asia Partners). Asia Partners makes private equity and private equity-related investments in technology or technology-enabled companies focused primarily on the Southeast Asia region. On 3 March 2021, Asia Partners, who had an initial target fund size of $300 million, announced its final close at $384 million in commitments. Up to 30 June 2021, Remgro invested $11 million, which included $1 million relating to fund closing costs. As at 30 June 2021 the remaining commitment to Asia Partners amounted to $15 million. Subsequent to 30 June 2021 Remgro invested a further $6 million in Asia Partners.
The following tables represent the cash effects of Remgro’s investment activities for the year to 30 June 2021. These activities exclude the investing activities of Remgro’s operating subsidiaries, i.e. RCL Foods, Distell Group Holdings Limited, Siqalo Foods Proprietary Limited and Wispeco
Holdings Proprietary Limited.
| Investments made and loans granted |
R million |
| CIVH |
1 636 |
| RCL Foods |
234 |
| Invenfin Proprietary Limited |
192 |
| Asia Partners (offshore) |
157 |
| Pembani Remgro Infrastructure Fund (PRIF) |
114 |
| Other |
63 |
| |
2 396 |
| |
|
| Investments sold and loans repaid |
R million |
| FirstRand (after transaction costs) |
2 019 |
| CIVH (loan) |
468 |
| Milestone Capital Funds (offshore) |
218 |
| Saracens Copthall Llp |
142 |
| Other |
101 |
| |
2 948 |
| |
|
Investment commitments
The table below summarises the investment commitments of Remgro as at 30 June 2021.
| Investment commitments |
R million |
| CIVH |
2 124 |
| Asia Partners |
213 |
| PRIF |
164 |
| Other |
63 |
| |
2 564 |
| |
|
Relative performance of intrinsic net asset value and Remgro internal rate of return (IRR)
The table below compares the Remgro intrinsic net asset value per share with certain selected JSE indices at 30 June during the last five years. The material decrease in the Remgro share price and intrinsic net asset value on 30 June 2020 reflects the unbundling of Remgro’s interest in RMH on 8 June 2020, as well as the negative impact of the Covid-19 pandemic.
| |
30 June
2021 |
30 June
2020 |
30 June
2019 |
30 June
2018 |
30 June
2017 |
| Intrinsic net asset value – Rand per share |
177.33 |
154.47 |
233.03 |
256.97 |
251.48 |
| JSE – All Share Index |
66 249 |
54 362 |
58 204 |
57 611 |
51 611 |
| – Capped Swix All Share Index |
18 865 |
15 184 |
17 685 |
18 162 |
17 371 |
| – Fin & Ind 30 Index |
83 912 |
70 975 |
77 459 |
78 391 |
73 184 |
| – Financial 15 Index |
13 103 |
10 034 |
16 993 |
16 139 |
14 470 |
| – Healthcare |
4 155 |
3 894 |
3 861 |
6 800 |
7 538 |
| Remgro share price (Rand) |
114.60 |
99.90 |
187.90 |
204.29 |
213.46 |
| |
|
|
|
|
|
The following table compares Remgro’s IRR with that of certain selected JSE indices. For this purpose it has been assumed that dividends, which include the unbundling of Remgro’s interest in RMH, have been reinvested in either Remgro shares or in the particular index, depending on the specific calculation.
| |
One year
30 June 2021
(% year
on year) |
Five years
30 June 2021
(% compounded
per annum) |
Ten years
30 June 2021
(% compounded
per annum) |
| JSE – All Share Index |
25.1 |
8.1 |
13.9 |
| – Capped Swix All Share Index |
27.6 |
4.3 |
20.5 |
| – Fin & Ind 30 Index |
20.0 |
5.5 |
15.7 |
| – Financial 15 Index |
33.4 |
2.3 |
11.7 |
| – Healthcare |
6.7 |
(14.7) |
11.1 |
| Remgro share |
15.6 |
(6.7) |
10.7 |
| |
|
|
|
Economic commentary and outlook
Covid-19 and the associated response from governments, firms and consumers to the pandemic continue to dominate the global and South African economic landscape. It is pleasing that both the global and domestic economy have recovered at a faster-than-expected pace from the hard lockdown shock in the second quarter of 2020. However, the global recovery has been very uneven, both within and between countries.
The US and China have led the recovery, with the Eurozone starting to catch up since the second quarter of 2021. The US economy already returned to its pre-Covid-19 level of overall economic activity (GDP) in the second quarter of 2021. According to the National Bureau of Economic Research, the US recession that began in March 2020 already ended in April 2020. Not only was the recession the deepest on record, but also by far the briefest. The swift US economic recovery was supported by an aggressive rollout of Covid-19 vaccines and an unprecedented scale of monetary and fiscal policy stimulus. The US also has a large internal consumer market, making it less dependent on foreign tourist spending.
Many emerging and developing countries, including South Africa, are in a much less fortunate position. The acquisition and rollout of vaccines across the world has been very uneven. Whether through a lack of access, scarce financial resources, or simply poor planning, developing countries are lagging behind significantly in the rollout of vaccines. As seen with South Africa’s devastating third wave of Covid-19 infections, this exposes these countries to (severe) further waves of infection. Health systems are overwhelmed, with authorities forced into announcing harsher (and more damaging to the economy) lockdown restrictions. In the case of South Africa, there has been a welcome increase in the pace of vaccinations as of late. After initial delays, enough vaccines have now also been secured to inoculate the adult population. Another major constraint for poorer countries is that they do not have the same fiscal firepower to support firms and their employees through the various rounds of lockdowns.
Although the authorities have learnt some hard lessons and the lockdown measures are no longer as draconian as the initial lockdowns in early 2020, each Covid-19 wave and the associated restrictions on movement and economic activity set back the economic recovery. The global travel restrictions imposed by many countries mean that regions more reliant on foreign tourists have been hit harder by the economic fallout of Covid-19.
On top of the continued impacts of the pandemic, the unprecedented looting and arson spree in KwaZulu-Natal and parts of Gauteng in July was another major blow to South Africa. Before these events, a better-than-expected start to 2021 saw forecasters upgrade their views on real GDP growth in 2021. The looting shock interrupted these upgrades. Indeed, the first batch of economic data releases for July was much weaker than expected, emphasising the scale of the impact. The medium-term implications of the looting shock remain unclear.
South Africa is fortunate that these heavy blows to the economy have been softened somewhat by a very strong, albeit softening of late, commodity price cycle. This has fuelled exceptional mining sector profits, resulting in large government revenue overruns relative to what was expected in the February 2021 budget. This has provided government with temporary fiscal space to provide additional income support for the poor. The commodity price boom is also reflected in large surpluses on South Africa’s external trade balance. This has been a major underpin for the rand exchange rate. In turn, the largely resilient currency has contributed to subdued domestic consumer inflation despite fast rising input costs. This has created the space for the SA Reserve Bank to keep the policy interest rate at a multi-decade low, which is supporting the GDP recovery in South Africa.
In addition, revised GDP data from Stats SA, as well as a much better-than-expected GDP print for the second quarter of 2021 (both released after the July shocks), mean that even if GDP contracts in the third quarter, real GDP growth could still be in the region of 5% during 2021. Beyond 2021, the outlook for the global economy remains reasonably favourable. This is despite the emergence of more contagious variants of the coronavirus, which places downside risks to global growth. Domestically, it would be a mistake to assume that the commodity price windfall will continue to mask some of our underlying vulnerabilities. If ever there was a need for the South African government to speed up the implementation of growth and employment-enhancing structural reforms, it is now.
Conclusion
While considerable uncertainty still remains amidst the ongoing Covid-19 pandemic, slow vaccination progress and the fallout of the recent violent unrest in South Africa, I am encouraged by the number of people from all corners of society raising their hands to work towards a brighter future for South Africa despite the various challenges we face. Our healthcare workers, business, government and religious leaders, the people that cleared and repaired damaged neighbourhoods following the social unrest, our sports teams and athletes, and every other organisation and active citizen showing an unwavering commitment to the success of this country fills me with hope for our future.
Remgro remains committed to this country and we will continue to play our role in seeing South Africa come through these challenging times stronger as a nation. Now more than ever is the time to stand together as a country and move forward for the benefit of all our people.
I would also specifically like to thank my colleagues at Remgro and our underlying investee companies for their invaluable contributions towards our Group and this country during these incredibly trying times. Our thoughts and prayers remain with our colleagues and families that have lost loved ones during this time.

Jannie Durand
Chief Executive Officer
Stellenbosch
21 September 2021
Remgro’s unlisted investments were valued as follows:
Investment |
Air Products |
Business Partners |
CIVH |
eMedia Investments |
Kagiso Tiso Holdings (KTH) |
Milestone China Opportunities Fund III (Milestone III) |
PGSI |
Prescient China Equity Fund |
PRIF |
SEACOM |
Siqalo Foods |
TotalEnergies |
Wispeco |
Valuation methodology |
Discounted cash flow method |
Net asset value |
Discounted cash flow method |
Comparable market price |
Sum-of-the-parts (external valuation) |
Sum-of-the-parts |
Discounted cash flow method |
Sum-of-the-parts |
Sum-of-the-parts |
Discounted cash flow method |
Discounted cash flow method |
Discounted cash flow method |
Discounted cash flow method |
Intrinsic net asset value(1)
| |
30 June 2021 |
30 June 2020 |
| R million |
Book
value |
Intrinsic
value(2) |
Book
value |
Intrinsic
value(2) |
| Healthcare |
|
|
|
|
| Mediclinic(3) |
24 581 |
19 358 |
27 443 |
18 769 |
| |
|
|
|
|
| Consumer products |
|
|
|
|
| RCL Foods(3) |
8 262 |
6 926 |
7 189 |
6 029 |
| Distell |
7 578 |
11 665 |
7 128 |
5 330 |
| Siqalo Foods |
6 226 |
7 277 |
6 285 |
6 145 |
| |
|
|
|
|
| Financial services |
|
|
|
|
| RMI |
10 174 |
14 713 |
9 736 |
13 708 |
| Business Partners |
1 273 |
1 273 |
1 244 |
1 232 |
| |
|
|
|
|
| Infrastructure |
|
|
|
|
| CIVH |
4 981 |
12 054 |
4 458 |
10 584 |
| Grindrod |
842 |
842 |
532 |
532 |
| SEACOM |
23 |
799 |
8 |
909 |
| Other infrastructure investments |
701 |
701 |
226 |
226 |
| |
|
|
|
|
| Industrial |
|
|
|
|
| Air Products |
1 063 |
4 523 |
1 264 |
3 979 |
| TotalEnergies |
2 242 |
2 539 |
2 029 |
2 515 |
| Wispeco(3) |
1 229 |
1 188 |
1 008 |
810 |
| Other industrial investments |
198 |
415 |
205 |
309 |
| |
|
|
|
|
| Diversified investment vehicles |
|
|
|
|
| KTH |
1 456 |
2 044 |
1 601 |
1 961 |
| Milestone III |
1 234 |
1 234 |
1 251 |
1 251 |
| Prescient China Equity Fund |
1 211 |
1 211 |
1 156 |
1 156 |
| Other diversified investment vehicles |
1 449 |
1 567 |
1 050 |
1 107 |
| |
|
|
|
|
| Media |
|
|
|
|
| eMedia Investments(3) |
815 |
616 |
805 |
947 |
| Other media investments |
3 |
137 |
41 |
41 |
| |
|
|
|
|
| Portfolio investments |
|
|
|
|
| FirstRand(4) |
7 659 |
7 659 |
7 068 |
7 068 |
| Other portfolio investments |
661 |
661 |
782 |
782 |
| |
|
|
|
|
| Social impact investments |
135 |
135 |
331 |
331 |
| |
|
|
|
|
| Central treasury |
|
|
|
|
| Cash at the centre(5) |
9 706 |
9 706 |
17 073 |
17 073 |
| Debt at the centre |
(7 821) |
(7 821) |
(15 288) |
(15 288) |
| |
|
|
|
|
| Other net corporate assets |
2 178 |
2 919 |
2 148 |
2 817 |
| Intrinsic net asset value (INAV) |
88 059 |
104 341 |
86 773 |
90 323 |
| Potential CGT liability(6) |
|
(4 150) |
|
(3 050) |
| INAV after tax |
88 059 |
100 191 |
86 773 |
87 273 |
| Issued shares after deduction of shares repurchased (million) |
565.0 |
565.0 |
565.0 |
565.0 |
| |
|
|
|
|
| INAV after tax per share (Rand) |
155.86 |
177.33 |
153.59 |
154.47 |
| Remgro share price (Rand) |
|
114.60 |
|
99.90 |
| Percentage discount to INAV |
|
35.4 |
|
35.3 |
| |
|
|
|
|


